 JavaScript Profiler
Overview
JavaScript Profiler is a Chrome extension developed by Germain UX.
According to the data from Chrome web store, current version of JavaScript Profiler is 2022.3.2, updated on 2022-10-09.
515 users have installed this extension.
8 users have rated this extension with an average rating of .
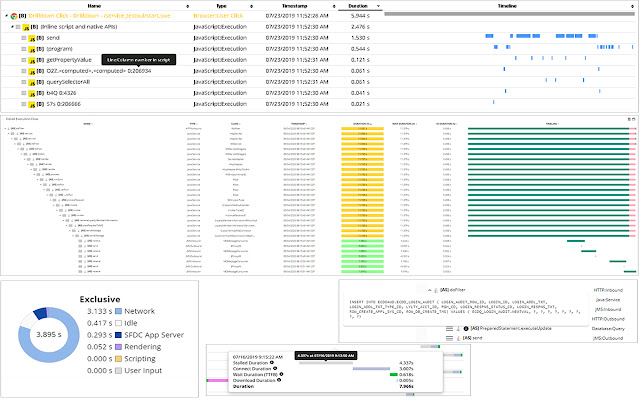
JavaScript Code Execution Analysis, real-time, 24x7. Provided by Germain UX
Features:
- Analyze JavaScript execution, in real-time, 24x7
- Correlate JavaScript calls with Application Back-end Code (e.g Java, C#, Python, Php, etc), Database SQL, Integration, etc
- All the above metrics can viewed on Germain UX dashboard (onPremise or cloud instance: https://germainux.com/cloud-login)
- Automate Task (Alert, Data Update, Service Restart, Reporting, etc)
- For all your users or a targeted user
Benefits:
- Identify whether a User Experience issue is caused by slow or failing JavaScript, browser, network, infrastructure, application, database, and deep dive within the code (JS or backend), in real-time, 24x7
JavaScript Profiler Alternatives


Latest Reviews
See More|
2021-07-23
Not useable without account. |
|
2021-01-05
Great tool to debug performance issues! |
|
2021-01-05
Provides great additional insight into browser performance! |
|
2021-01-05
I was able to get complete JS execution insights with this extension. Helped me in root-cause analysis for my end users transaction. Super happy with this extension and germain APM. |
|
2021-01-05
Made it easy to separate script performance issues from users internet issues |